PAFnow
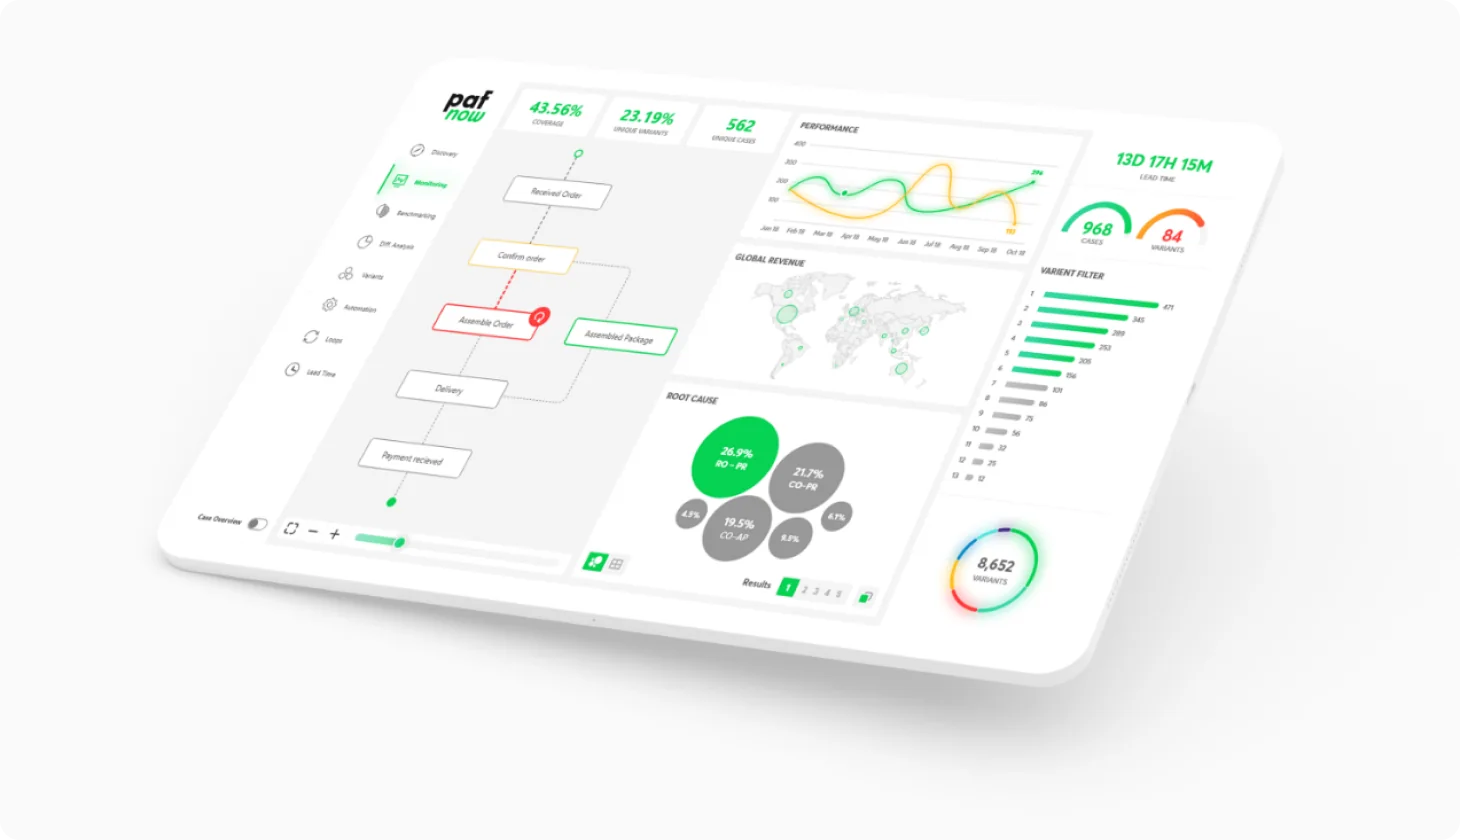
Cut client onboarding cost by 80% by turning a dense process mining tool into a guided experience
- My role
- Founding Product Designer
- Team
- 12 engineers, 5 data scientists, 6 Sales
- Platform
- Web, inside Microsoft Power BI
- Tools
- Figma, Power BI
 Merger & Acquisition
The context
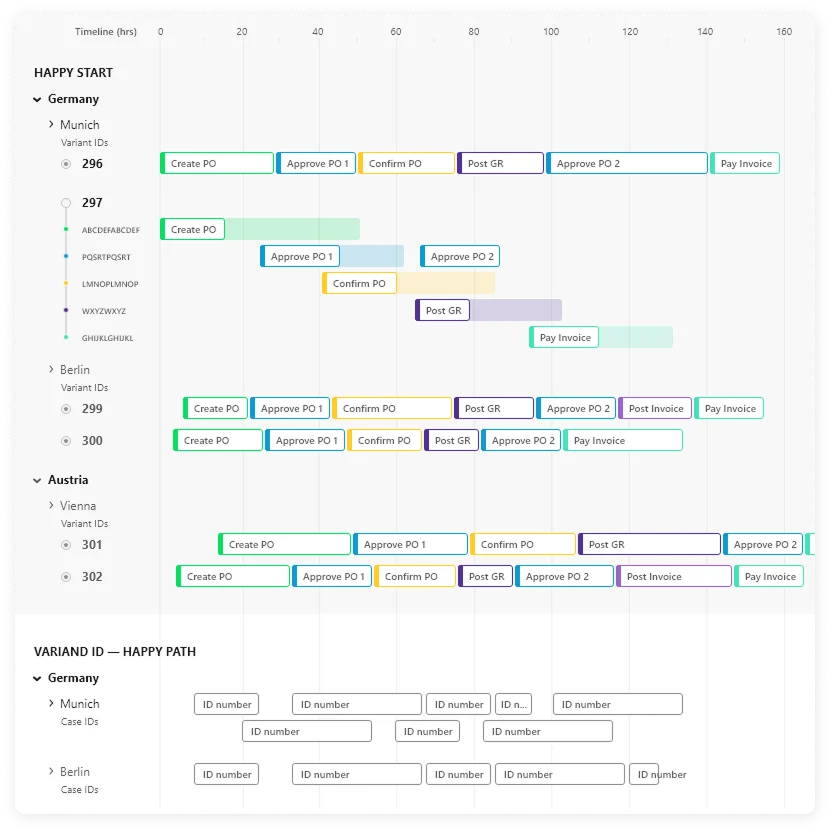
PAFnow lets large companies see how their processes really run. It reads event logs, builds a "bird's eye view" of a workflow and shows where delays, rework and bottlenecks happen. Enterprise customers in industries like aviation, chemicals and automotive use it to find what slows their operations down.
When I joined as the founding designer, the product was early, technically strong and powerful. But using it felt very different from what the tech promised.
The problem
The product was a dense ecosystem of dashboards with process views, event views, case views and analytical layers. Rich in features, but:
- Overwhelming, data heavy screens
- Complex visuals, no clear path
- Insights buried under layers of filtering
- Too many dependencies
My role
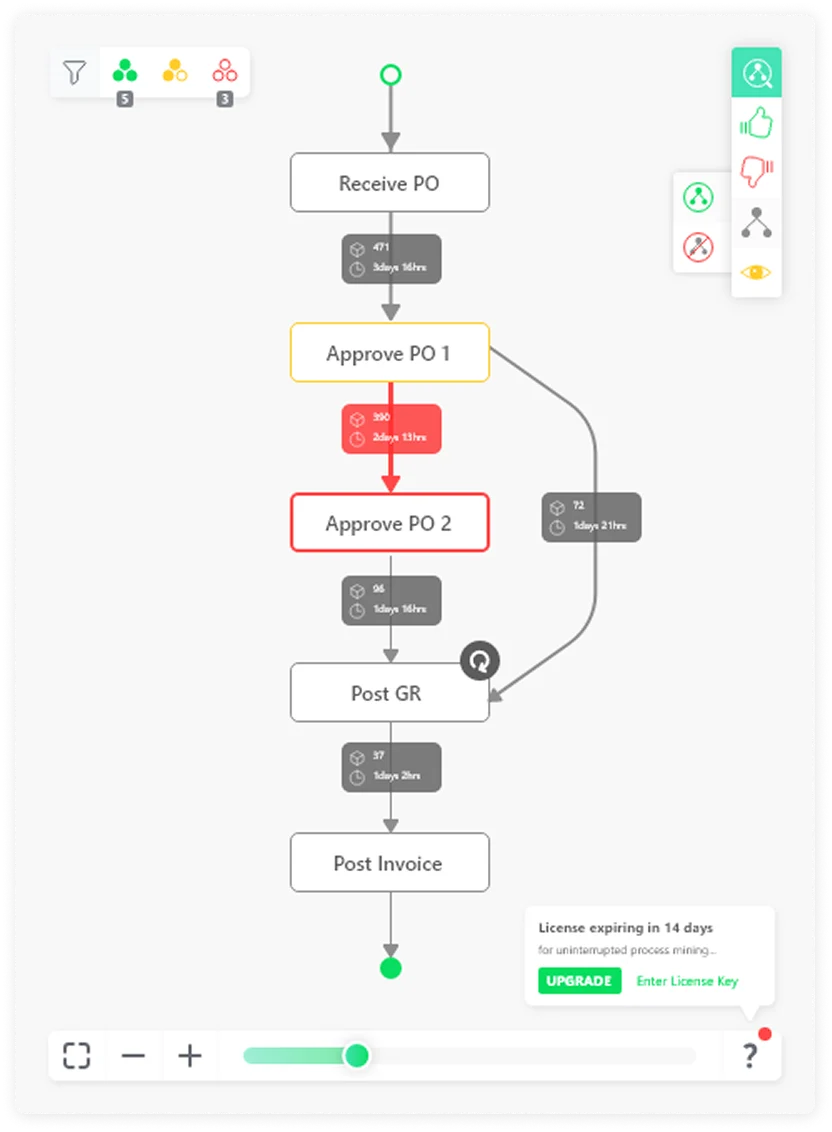
Being a founding designer to own the whole product for the first time was overwhelming. However, Timo, our CEO, helped me understand process mining and I was able to visualize his technical ideas into clear, understandable and interactive graphs.
Discovery
- Audited every existing dashboard to find friction points
- Observed how users worked through their analysis at major clients
- Mapped the key user journeys across workflows
- Attended onboarding sessions, not only to empathise with users but also learn the product
Insights
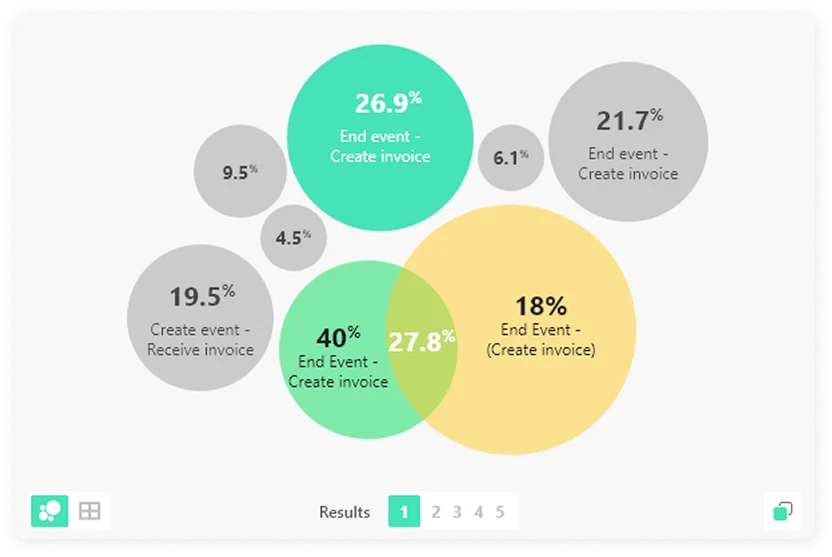
The problem wasn't complexity, it was how complexity was presented. Raw data isn't understanding, clarity is. So instead of simplifying features, I focused on orchestrating information: what to show first, what next, and what can wait.
The goal
Keep the product's power, but make it accessible:
- Make insights understandable at a glance
- Reduce cognitive effort across workflows
- Guide users toward meaningful actions
- Create consistency across the product
Success meant a smooth flow from data → insight → decision.
Approach: clarity first
Instead of exposing everything at once, I restructured the experience to:
- Process map: Prioritise critical information
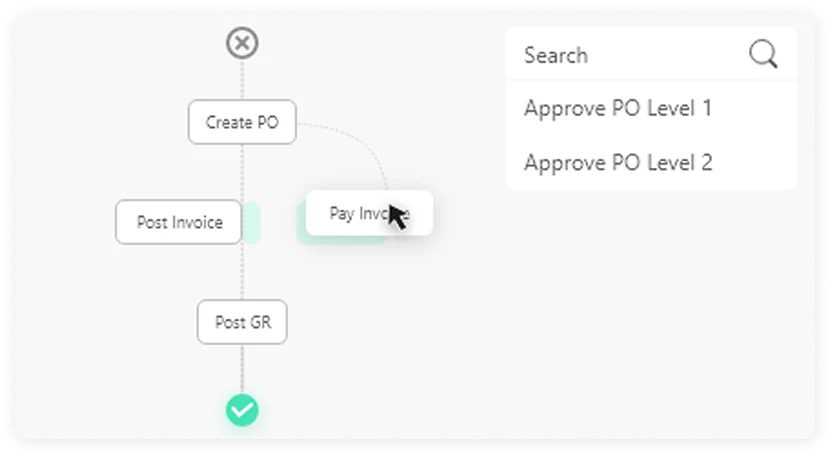
- Event filter: Guide users through intentional flows
- Power BI Dashboards: Replace exploration fatigue with confidence
The product moved from a static set of visuals to a guided analytical experience. My rule for every decision: make the next step obvious.
Branding & visual language
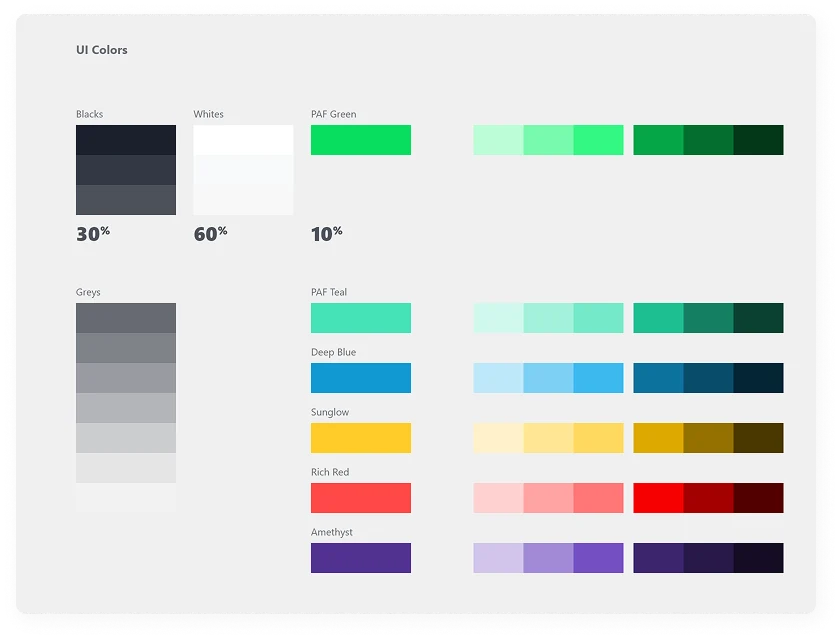
The product lacked a cohesive identity, so I refined its visual language:
- Colour used consistently to carry meaning (not decoration)
- A balance of analytical depth and modern product look
- A tone that feels confident but approachable
PAFnow began to feel like a designed product, not just a technical layer on top of Power BI.
Design system
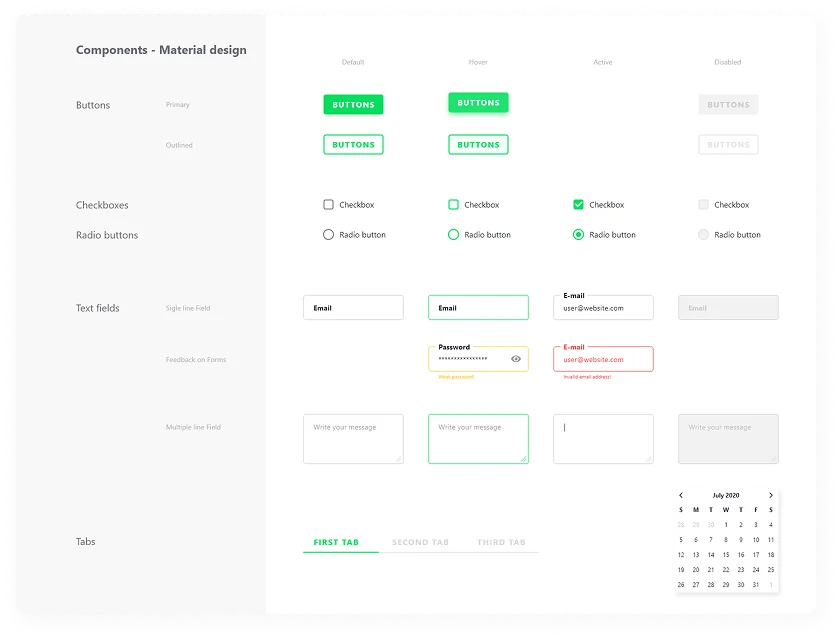
To keep it scalable I built a foundation with:
- Standard layout structures for dashboards
- Typography, spacing and hierarchy rules
- Reusable components for charts, filters and navigation
- Consistent interaction patterns across the platform
Fragmented screens became one predictable system, bringing consistency among 12 developers and saved time recreating components.